Precision agriculture
Pilot programmeKnow what your soil needs. Before you spend on fertiliser.
Dhara maps soil nutrients from space — across every 10 × 10 metre square of a field, in minutes. No sample collection. No laboratory queue. No waiting on a season that has already started.
The problem
Indian agriculture is fertilising in the dark
Most fertiliser decisions in India are made without knowing what the soil actually contains.
- 01
The soil is not uniform
Nutrient levels differ corner to corner, and shift with every rainfall, every crop stage and every application.
- 02
Four or five samples are taken
From the whole field, sent to a laboratory, once in several years — where testing happens at all.
- 03
One average number comes back
A single static figure standing in for a system that never holds still.
- 04
The same dose goes everywhere
One corner starved of nitrogen while another is oversupplied. A field-average recommendation gets both wrong.
-
What it costs
The farmer pays twice
Once for fertiliser that does nothing, and again in the yield that soil degradation takes away over the years that follow.
20–35%
India's fertiliser use efficiency — 65–80% of what is applied never reaches the crop
₹1.5–2.5 lakh cr
India's annual fertiliser subsidy, much of it funding nutrients that never feed a plant
4–5 samples
Taken from an entire field, once in several years, under traditional testing
Industry and policy estimates. Source citations to be added before launch.
What Dhara does
Soil intelligence, resolved to the square
Dhara applies hyperspectral image analysis and machine learning to satellite imagery of a specific field. You supply the coordinates; Dhara returns a nutrient map.
Four or five samples, averaged
One number for the whole field
Every square metre gets the same recommendation, because every square metre was given the same number. The starved corner and the oversupplied one are both invisible — and both get the same dose.
Dhara, at 10 × 10 metres
A value per square
The same field, assessed square by square. The depleted band in the lower left is a real management decision: more there, less elsewhere, and a different bill at the end of it.
- Resolution
- Every 10 × 10 metre square assessed separately, so variation within a field is visible rather than averaged away.
- Parameters
- Nitrogen (N), phosphorus (P), potassium (K), organic carbon and pH.
- Speed
- A pictorial report in minutes, not the weeks a laboratory cycle takes.
- Output
- A visual map of deficiency and surplus across the field, with a fertiliser recommendation matched to what each part of the field actually needs.
- Delivery
- Through the Rosni Prime app for individual farmers; through APIs and bulk deployment for enterprises and institutions.
- Input required
- Coordinates. No sample collection, no transport, no laboratory queue.
From a field boundary to a sheet in the farmer's hand
-
You supply the field
Coordinates or a drawn boundary. Nobody walks the field and nobody takes a sample.
-
Satellite imagery is captured
Hyperspectral and multispectral imagery of that specific field.
-
The imagery is analysed
Machine learning models trained on Indian soils read nutrient signatures out of the spectra.
-
A nutrient map is produced
Every 10 × 10 metre square assessed separately, so variation inside the field survives.
-
The farmer receives a sheet
One per nutrient layer, in the language he reads, showing where in his own field the problem is.
The output
What the farmer actually receives
Not a dashboard login. A set of sheets, one per nutrient layer, in the language the farmer reads — each one showing where in his own field the problem is, and what it costs him to ignore it.
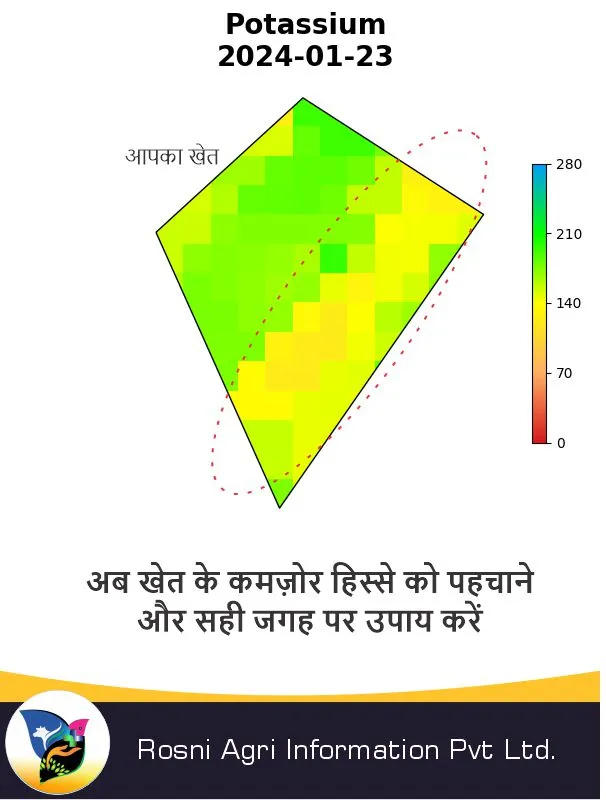
Potassium
“Now find the weak parts of your field — and treat them in the right place.”
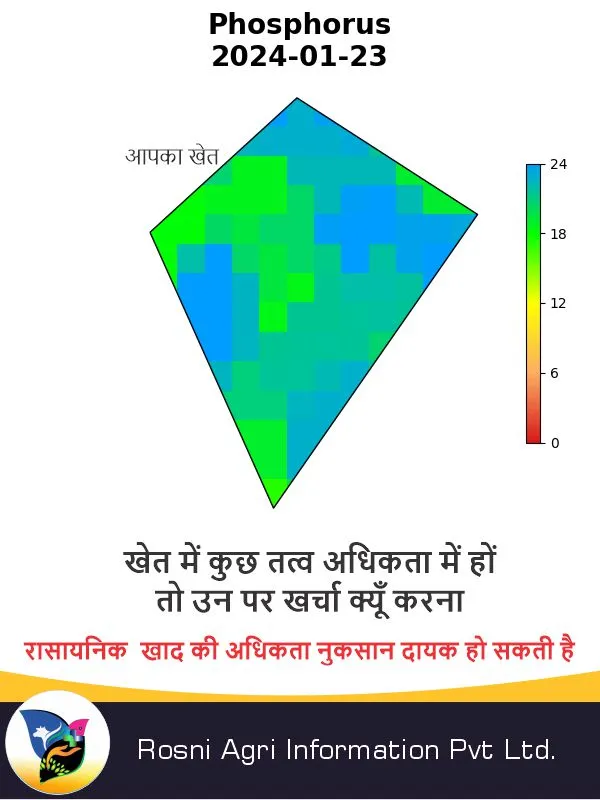
Phosphorus
“If some nutrients are already in surplus, why spend on them? Excess chemical fertiliser can do harm.”
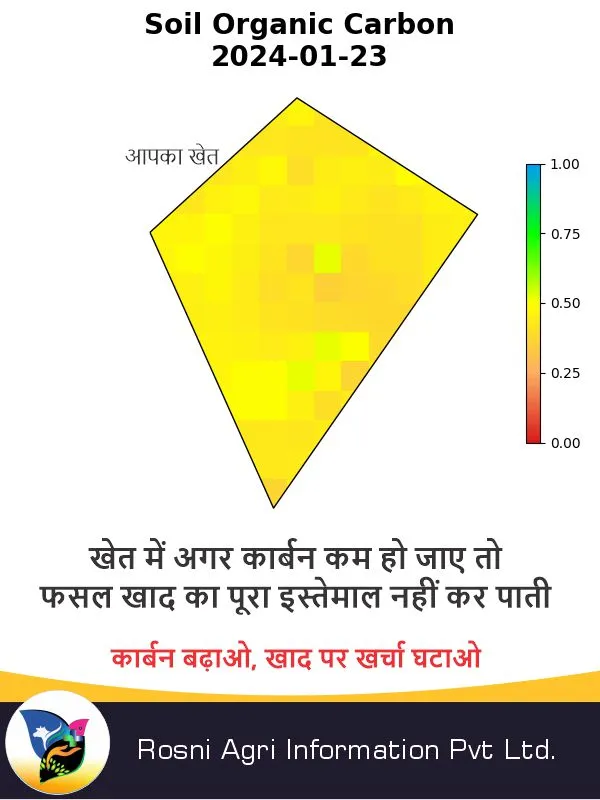
Soil organic carbon
“If carbon falls, the crop cannot make full use of the fertiliser. Raise carbon, cut fertiliser spend.”
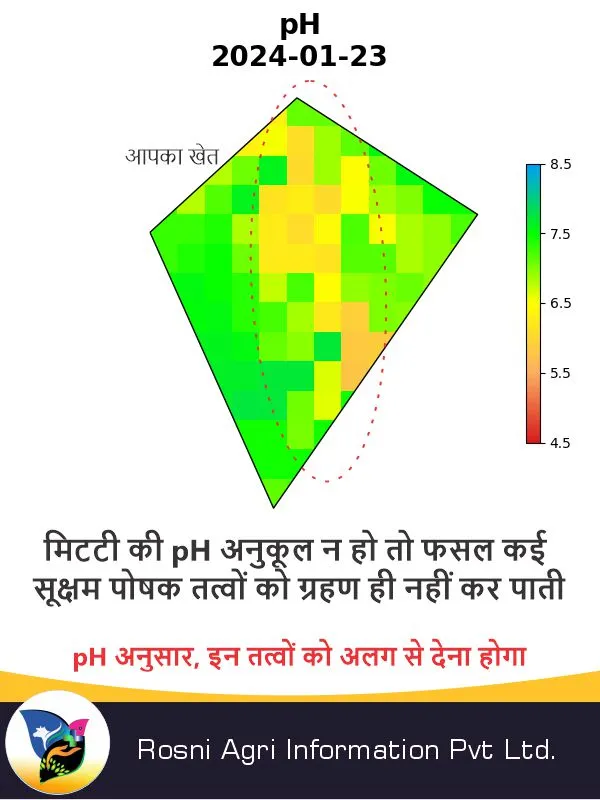
pH
“If soil pH is wrong the crop cannot take up several micronutrients at all — they have to be supplied separately, according to pH.”
Four layers from a single field, 23 January 2024. The English lines are translations of the Hindi printed on each sheet. A full Dhara report covers nitrogen, phosphorus, potassium, organic carbon and pH.
In ninety seconds
How satellite soil testing works
Why a laboratory sample cannot describe a field, what the satellite measures instead, and how that becomes an instruction a farmer can act on.
Dhara Plus
Expected early 2027Stop reacting to deficiency. Start forecasting it.
Dhara tells you what your soil holds today. Dhara Plus tells you what your crop will be short of next — and what to do about it while there is still time to act. Expected to release at the start of 2027.
Three data streams, one forecast
Nutrient availability and uptake shift constantly — with moisture, weather, crop growth stage and the crop's own changing demand. A reading taken at sowing cannot describe what the crop will face at flowering. Dhara Plus fuses three independent sources to model that movement:
-
Multispectral satellite data
Crop and soil condition across the season
-
SAR — Synthetic Aperture Radar
Soil moisture and structure, seen through cloud that stops optical imagery
-
Weather data
The conditions actually driving nutrient availability and uptake
What it delivers
- 12 nutrients, forecast
- N, P, K, S, Ca, Mg, Fe, Mn, B, Cu, Zn and Mo — not five parameters measured once, but the whole nutritional picture the crop depends on, projected forward.
- Resolved to 10 × 10 m grids
- The forecast is spatial, not a field-wide average — the same resolution as Dhara.
- Weak grid identification
- The specific squares heading for stress, flagged before the crop shows symptoms.
- Customised mitigation advisories
- What to apply to those grids, at what rate, and when, to head off the forecast stress.
- Machine feed
- A technical feed that drives the equipment doing the work.
- Cloud-proof
- SAR sees through cloud, so the season keeps being measured through the monsoon.
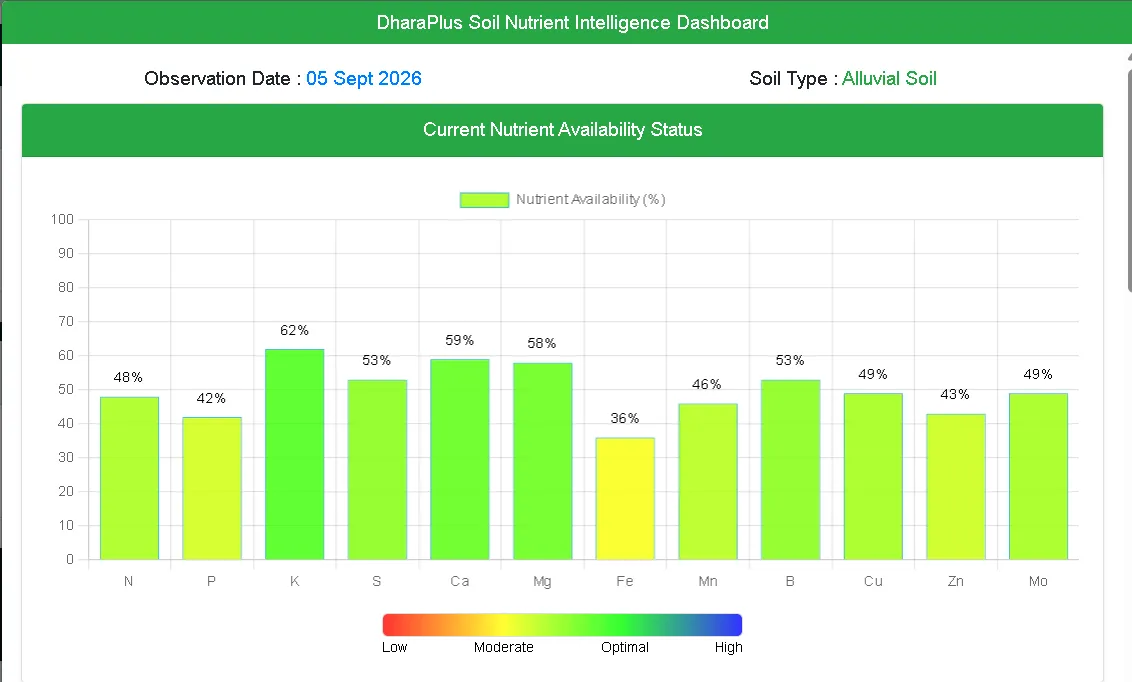
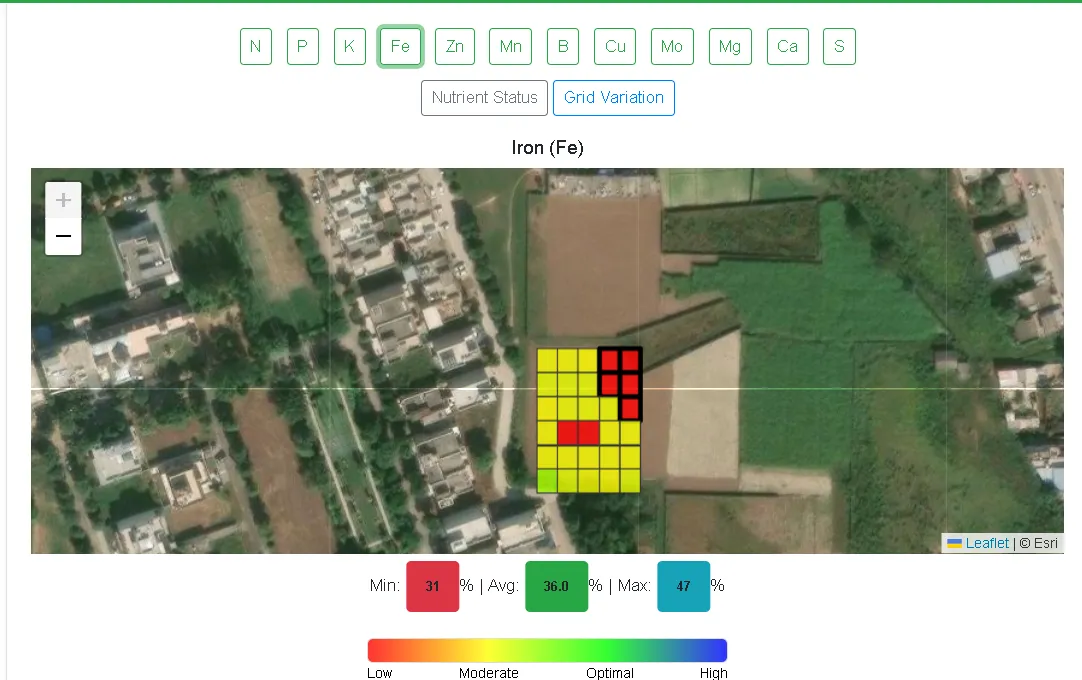
The field summary behind the maps: availability for every nutrient Dhara Plus models, on a single observation date, against the soil type it belongs to. It is the view that answers “what is this field short of, right now?” before you go looking at where.
Live interface, 5 September 2026. Alluvial soil.
Applied by whatever equipment you have
Precision advice is worthless if it cannot be executed. Dhara Plus outputs a feed for drones and fertiliser seed drills — and grid-referenced instructions for manual application by sprayer or hand broadcasting.
Most precision agriculture assumes machinery the average Indian farm does not own. Grid-referenced hand broadcasting makes the same intelligence usable by a farmer with a sprayer and a phone.
Dhara and Dhara Plus
| Dhara | Dhara Plus | |
|---|---|---|
| Question answered | What does my soil contain? | What will my crop be short of, and when? |
| Parameters | N, P, K, organic carbon, pH | 12 nutrients |
| Data sources | Hyperspectral satellite imagery | Multispectral + SAR + weather |
| Timing | Point-in-time reading | Forecast through the season |
| Output | Nutrient map and recommendation | Weak grids, mitigation advisory, machine feed |
| Acts on | Human decision | Drone, ferti drill, or manual application |
Why it scales
Designed for populations, not plots
Physical soil sampling does not scale. It needs collectors, transport, laboratory capacity and technical staff — and it still cannot cover a state inside a sowing window. Dhara needs coordinates.
- Regional and national programmes aimed at fertiliser efficiency and soil health
- Agri-enterprises managing large grower catchments
- Sugar mills, processors and exporters needing soil intelligence across every supplying field
- Regenerative agriculture projects, where continuous monitoring shows whether practices are working
- Research institutions studying soil dynamics at a scale physical sampling cannot reach
The wider case
Precision is also the sustainability argument
Applying fertiliser to actual need rather than to habit does more than save money.
- Less nitrogen lost to the atmosphere
- Excess soil nitrogen escapes as nitrous oxide, a greenhouse gas far more potent than carbon dioxide. Precision application reduces the excess.
- Healthier soil stores more carbon
- Avoiding over-fertilisation protects soil structure and organic matter — and soils with higher organic matter are better carbon sinks.
- Fewer field visits, less transport
- Removing physical sampling removes the fuel and laboratory processing that go with it.
- Cleaner water
- Nutrients that stay in the root zone do not run off into it.
From the field
The test a soil map has to pass
Not whether the science is elegant — whether the map agrees with what the farmer can already see standing in his own field.
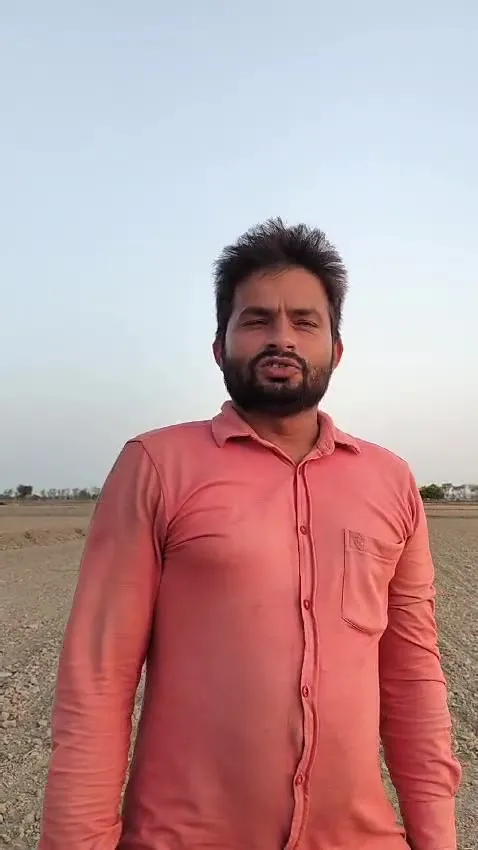
“My soil test report revealed nutrient deficiencies in exactly those patches where my crop had shown poor growth — and nowhere else.”
That is the argument for spatial soil testing in one sentence. A field-average laboratory report cannot make that claim, because it has already averaged the patches away.
Who it is for
One capability, five kinds of buyer
- Farmers
- Through the Rosni Prime app — a soil map and a fertiliser recommendation for your own field, without sending anything to a laboratory.
- Agri-enterprises
- Soil intelligence across an entire grower network, delivered by API.
- Sugar mills and processors
- Field-level soil data across the supply catchment — see also Harcane.
- Government and institutions
- Fertiliser-efficiency and soil-health programmes at district, state or national scale.
- Research organisations
- Repeatable, spatially resolved soil data for applied research.
Alignment
Built for national priorities
Dhara's approach supports the objectives of the Soil Health Card Scheme, and contributes to Atmanirbhar Bharat and Digital India — reducing dependence on fertiliser imports while putting decision-grade data directly into farmers' hands.
Let's put this on your fields
Whether you farm ten acres or run a programme covering ten districts, the starting point is the same: a set of coordinates.