
Crop area intelligence
Know exactly how much maize is out there. Before you plan around it.
PowerMaize+ measures maize area from satellite for any state, district or village in India, at 95%+ accuracy — a planning number that does not depend on the reporting chain that produced it.
At a glance
- Measures
- Kharif and spring maize area
- Accuracy
- 95%+
- Resolves to
- State, district, village
- Used by
- Government and agri-input companies
One method applied everywhere, so two geographies can be compared without first arguing about the numbers.
The problem
Every maize plan in India starts with a number nobody can check
How much maize is planted, and where, is the first input into almost every commercial and policy decision about the crop — and it is usually the weakest one.
- 01
A village judgement is made
By people with other work to do, under time pressure, at the only level where anyone actually sees the fields.
- 02
It becomes a block total
Aggregated upward by someone who cannot check the figure they were handed.
- 03
Then a district, then a state
Nobody in the chain can audit the step below them, and the result arrives well after the sowing decisions it describes.
- 04
A company builds a season on it
Targets set territory by territory, stock positioned, field staff deployed, campaigns budgeted — against a picture that may be materially wrong in exactly the districts where wrong costs most.
-
What it costs
The post-mortem examines the execution
Because the assumption underneath it was never treated as a variable in the first place.
Village
The level decisions are actually executed at
District
The level most area data is usable at
95%+
PowerMaize+ measurement accuracy
A sales plan is only as good as its denominator. If you do not know the hectares, you do not know your share — you only know your volume.
What it does
Maize area, measured from orbit
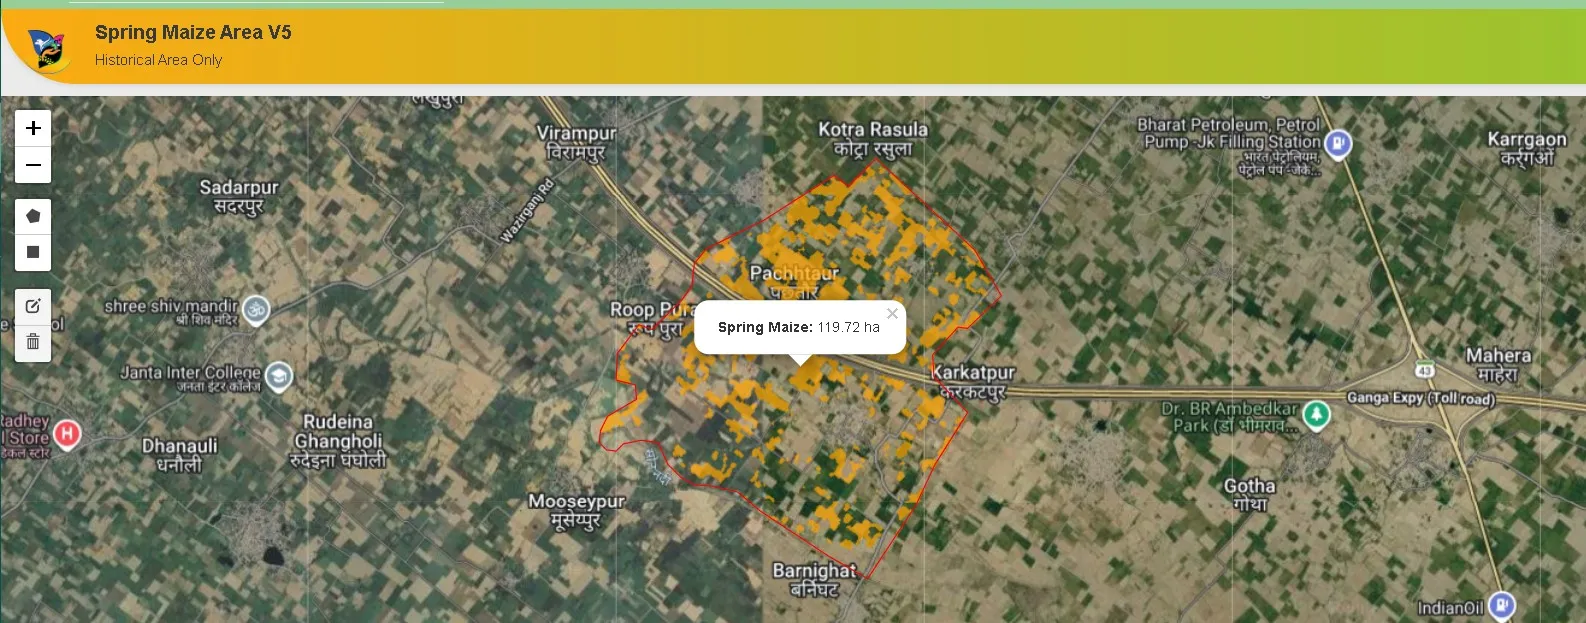
PowerMaize+ classifies the standing maize crop from satellite imagery and reports the area against administrative boundaries — the same units a company or a department already plans in.
- Area, at any level you plan at
- Maize area for a state, a district, a block or a single village — the same measurement, aggregated to whatever unit the decision is being made in. The village is the smallest unit, and the one field teams actually work in.
- 95%+ accuracy
- Measured from satellite imagery of the standing crop rather than assembled from field reports, so it does not inherit whatever the reporting chain got wrong — and it can be checked.
- Season on season
- The same villages measured the same way each year, which is what turns an area figure into an area trend.
- Comparable across geographies
- One method everywhere means a district in Bihar and a district in Karnataka can be put on the same page without arguing about the numbers first.
- Ready for a planning system
- Delivered as data against administrative boundaries, so it drops into the territory, target and forecasting tools a company already runs.
How the number is produced
-
A boundary is selected
A state, a district, a block or a single village — whichever unit the decision is being made in.
-
The standing crop is imaged
Satellite imagery of the crop as it stands, not a report of what somebody intended to sow.
-
Maize is separated from everything else
Classification models distinguish maize from the paddy, cotton and cane around it, parcel by parcel.
-
Area is measured and aggregated
Parcel areas summed to whatever administrative level you asked for, at 95%+ accuracy.
-
It arrives as planning data
Delivered against administrative boundaries, so it drops straight into the territory and forecasting tools already in use.
For maize seed companies
Six decisions that change when you know the hectares
A seed business is a distribution business. Almost every lever it pulls — where people sit, where stock goes, who gets appointed, what a territory is expected to deliver — is a bet on where the crop is. Area turns those bets into arithmetic.
- Size the seed opportunity, village by village
- Area multiplied by seed rate is the volume a territory can physically absorb. That number is the ceiling on a sales target — and the floor under a stocking plan. It is also what turns “we should do better in Bihar” into a hectare figure somebody can be held to.
- Put the headquarters where the crop is
- Sales territories and field-officer headquarters are usually inherited — drawn years ago, around an office that already existed. Area distribution redraws them around the hectares, so travel time falls and coverage rises without adding headcount.
- Find the white spaces
- Blocks carrying substantial maize area with no dealer, no distributor and no field presence. These are the appointments worth making, and they are invisible in a sales report that can only show you where you already sell.
- Measure share properly
- Raw volume tells you which territory sells most. Volume against area tells you which territory sells most of what is there — a different list, and the one that shows where the real headroom is.
- Follow the area movement
- Maize gains and loses ground to paddy, cotton, soybean and sugarcane, and it does so district by district. Seeing that shift while it is happening is the difference between repositioning ahead of it and explaining it afterwards.
- Plan the campaign where the host crop is
- Fall armyworm pressure, herbicide demand and hybrid promotion all track maize area rather than total cropped area. Campaign spend follows the map instead of the last plan.
01
02
03
04
05
06
What changes in practice
- Area figure
- Assembled from field reports, arriving late → measured from satellite for the unit you plan in
- Territory design
- Inherited from an old office map → drawn around where the hectares actually are
- Stocking plan
- Last year plus a percentage → this season's area times a seed rate
- Market share
- Volume, which flatters big territories → volume against area, which does not
- Crop shift
- Noticed when sales fall → visible while the shift is happening
Beyond seed
Anyone whose business is a function of where the crop is
Maize area is the denominator under a surprising number of decisions that are currently made without it.
- Fertiliser and crop protection
- Maize-specific product demand — pre-emergent herbicide, FAW insecticide, a nutrient plan built for the crop — is a function of maize area, not of agriculture in general.
- Procurement and processing
- Poultry feed, starch and ethanol buyers use area to size a procurement catchment before committing to a plant, and to anticipate arrivals within a season.
- Government planning
- Crop area statistics for procurement planning, scheme targeting and extension deployment, at the administrative level the department actually works in.
- Crop insurance
- An independent area layer to set against enrolment data at village level, where the disputes usually are.
- Credit and rural finance
- Sizing an agri-input or crop-loan book in a district against what is actually being grown there.
- Contract farming and aggregation
- Identifying the villages carrying enough maize to be worth aggregating, before the field team is sent to find out.
Who it is for
One measurement, five kinds of buyer
- Maize seed companies
- Territory design, sales manpower placement, stocking plans and share measurement against real area rather than last year's assumption.
- Fertiliser and crop protection companies
- Demand planning and campaign targeting for crop-specific products.
- Government departments
- Independent crop area statistics for planning, procurement and scheme targeting.
- Processors and feed buyers
- Procurement catchment sizing and in-season arrival expectations.
- Insurers and lenders
- An independent area reference at the village level where claims and exposure are settled.
Scope
What PowerMaize+ covers today
PowerMaize+ measures the kharif and spring maize crop at 95%+ accuracy, and reports area against state, district and village boundaries. It is already in use in government and agri-input company planning.
Historical seasons are available alongside the current one, which is what makes year-on-year area movement visible rather than merely assertable.
Coverage, refresh timing and validation for a specific geography are best discussed against the territory you actually care about — tell us the states and we will tell you what the layer looks like there.
The same satellite crop-classification approach already runs on sugarcane, through Harcane. If maize is not the crop your planning turns on, it is worth asking.
Bring your territory map. We will show you the hectares.
The fastest way to see what PowerMaize+ is worth to you is to put it against a geography you already have an opinion about.