
Enterprise agriculture
Know your cane before it reaches the gate
Harcane maps every field in a mill's catchment from satellite — plant and ratoon area, standing crop, yield and brix — and updates it through the season. Farmer by farmer, village by village, centre by centre.
At a glance
- Area survey
- Farmer-level, auditable
- Standing crop
- Refreshed every fortnight
- Measured per field
- Area, yield, health, brix
- Covers
- A mill's entire catchment
Replaces a manual cane-staff survey that takes weeks and cannot be audited.
The problem
A mill plans a season on numbers it cannot verify
A sugar mill's entire operation depends on one question: how much cane is out there, and what is it worth?
- 01
Cane staff walk the catchment
Thousands of farmers and hundreds of villages, surveyed on foot and estimated by eye.
- 02
The estimates are entered by hand
It takes weeks, and it is out of date before it is compiled.
- 03
One area figure comes out
Nobody can audit it, and nobody can size how wrong it might be.
- 04
Every decision inherits it
Crushing plans, cane development spent evenly because nobody knows which fields are underperforming, harvest scheduling that cannot prioritise by maturity, and recovery left to chance when brix varies field by field.
-
What it costs
A season lost to what was outside the gate
A mill can be excellent at everything inside it and still lose the year to what it did not know outside.
The output
One boundary, one date, four answers
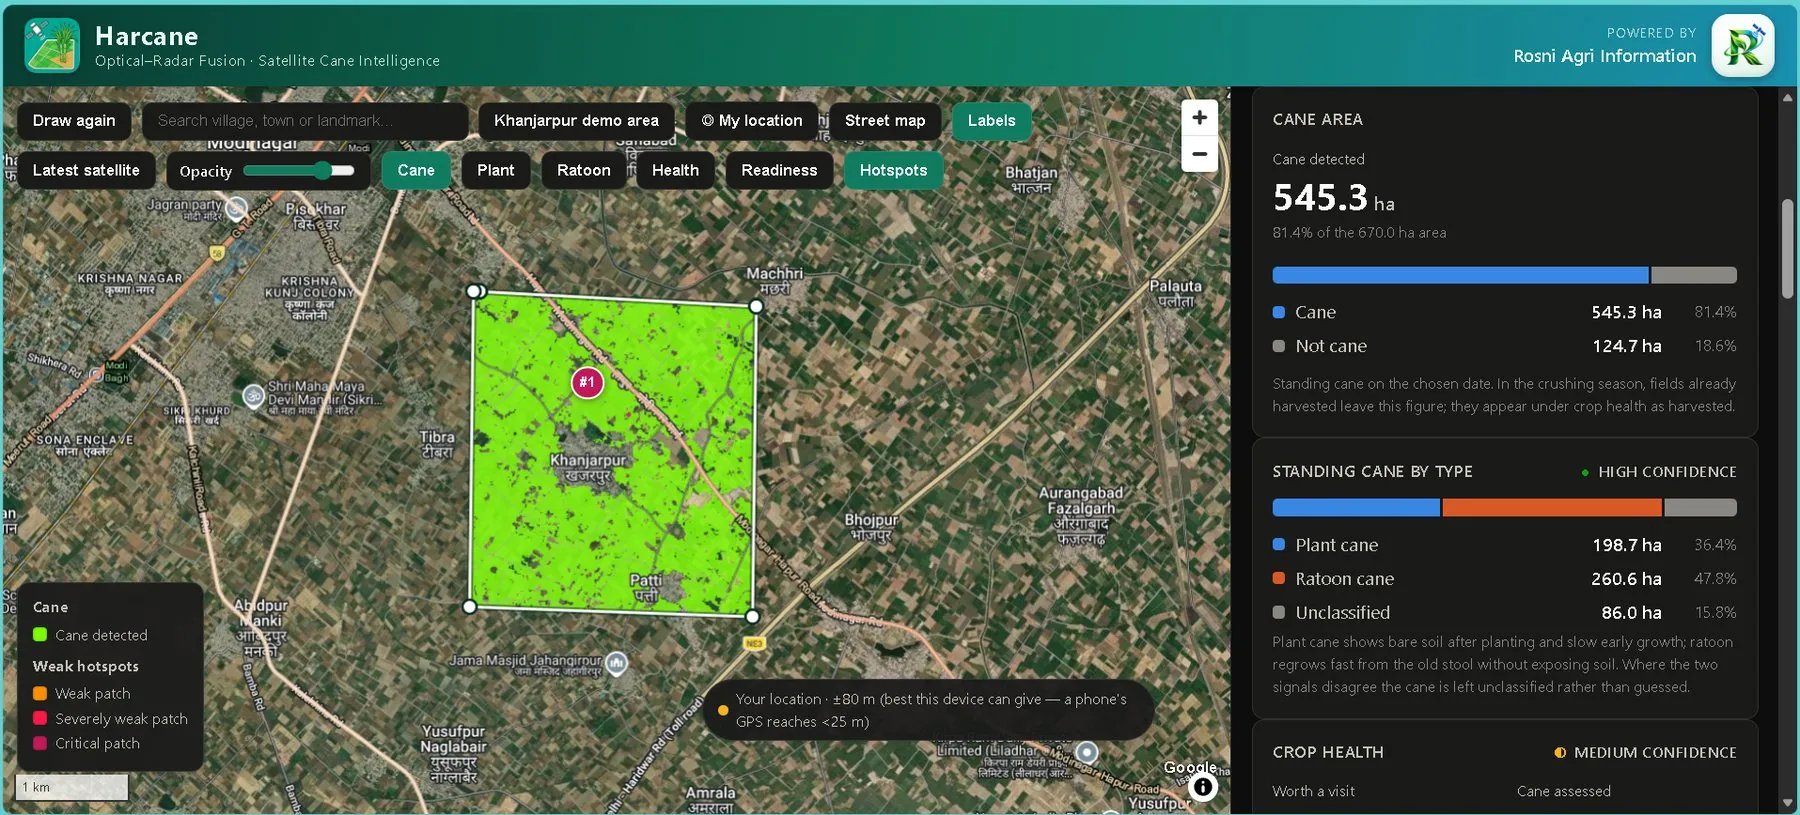
This is the product, not a mock-up of it. A 670-hectare block around Khanjarpur, near Meerut, analysed from radar and optical imagery captured on 25 September 2026.
-
01
Where the cane actually is
Standing cane separated from wheat, fallow, orchard and settlement across the whole boundary — on a chosen date, repeatable on any other.
Fields already harvested drop out of this figure and reappear under crop health as harvested — they are not silently counted twice.
- Cane detected
- 545.3 ha
- Of the drawn area
- 81.4%
- Not cane
- 124.7 ha
-
02
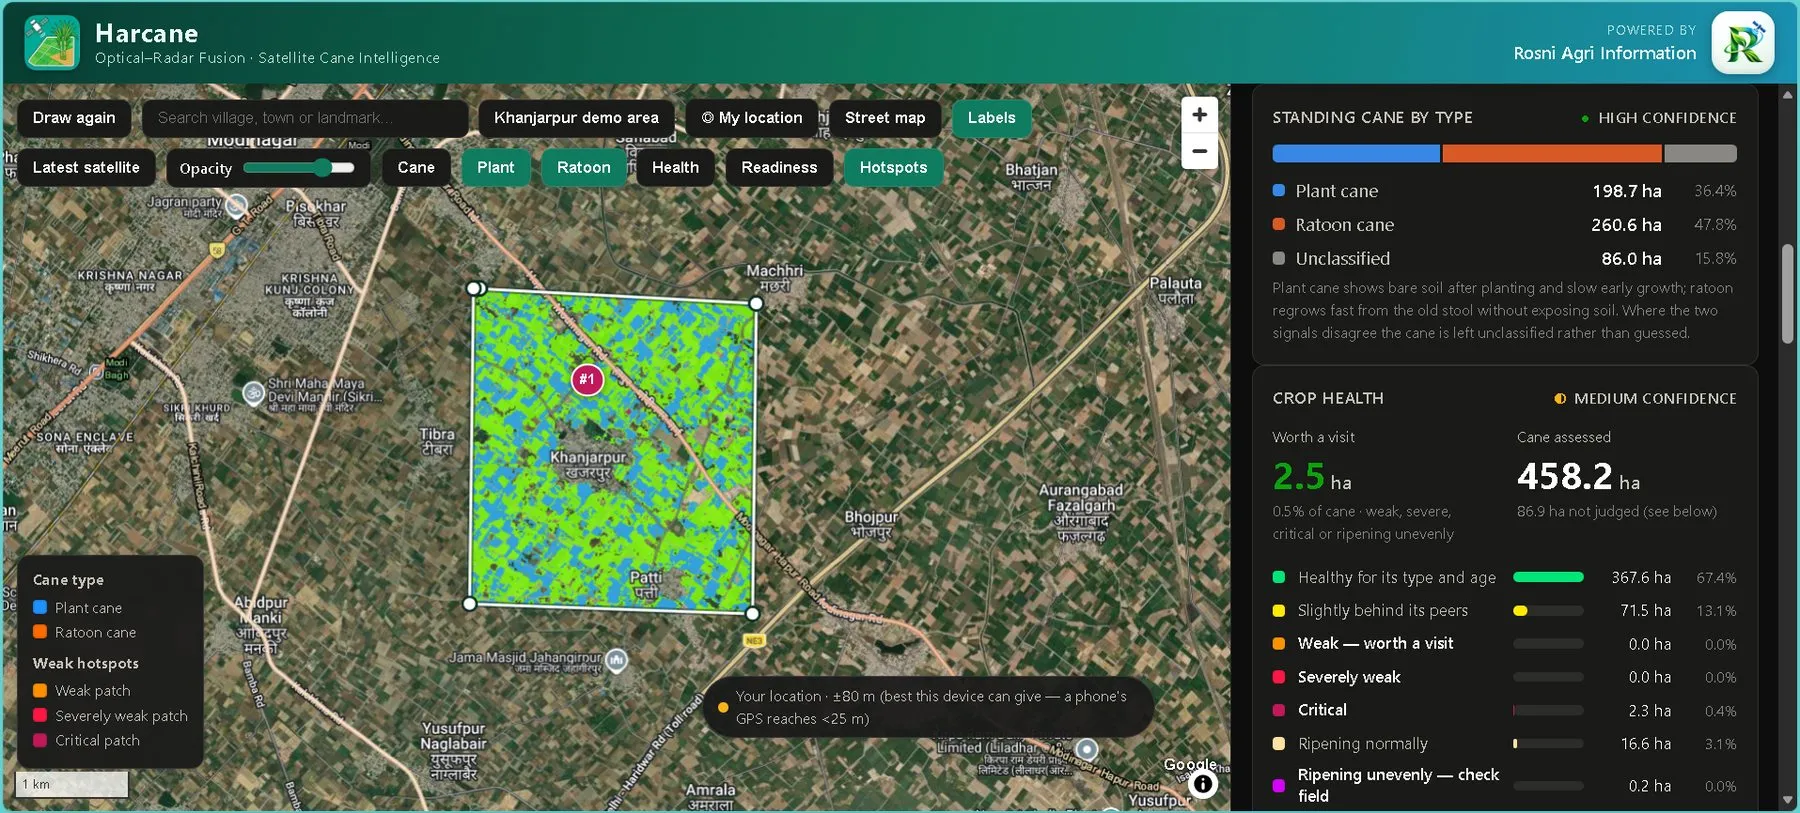
Plant cane or ratoon
Read from how each field started its season: plant cane shows bare tilled soil and a slow start, ratoon regrows fast from the old stool without ever exposing soil. The split drives yield expectation and replanting advice.
Where the optical and radar signals disagree, the cane is left unclassified rather than guessed. That is why the third row exists.
- Plant cane
- 198.7 ha · 36.4%
- Ratoon cane
- 260.6 ha · 47.8%
- Unclassified
- 86.0 ha · 15.8%
-
03
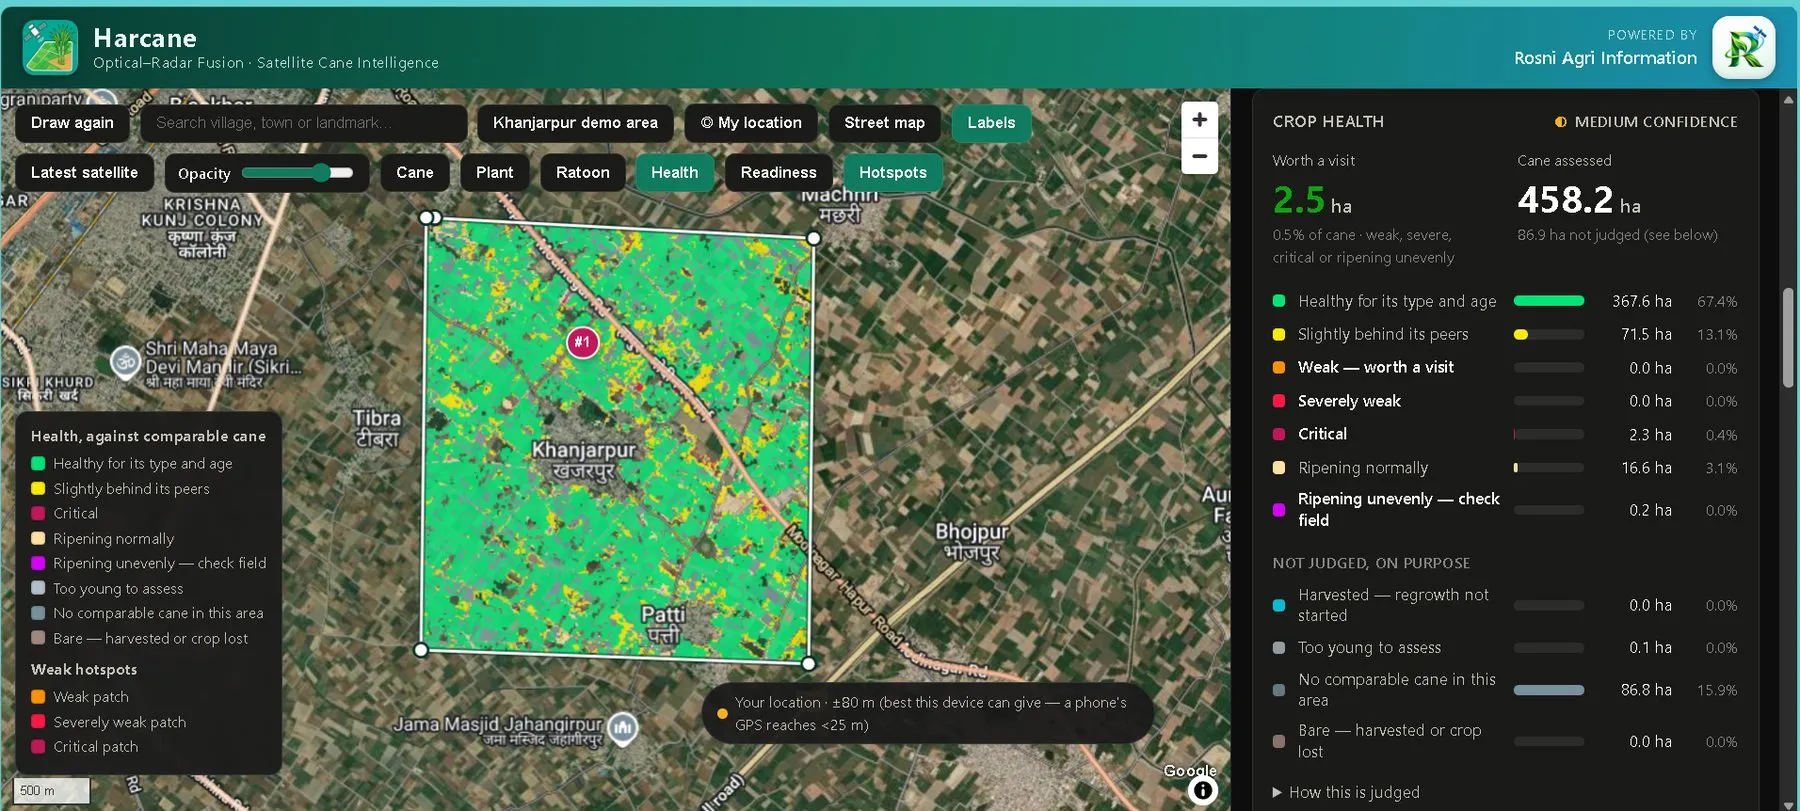
Which fields are worth a visit
Each field is compared only with cane of the same type and age nearby, so a young ratoon is never judged against mature plant cane. The output is a number a supervisor can act on this week.
Harvested, too-young and no-comparable-cane fields are set aside and counted, not misjudged. The interface labels this block “not judged, on purpose”.
- Worth a visit
- 2.5 ha · 0.5%
- Cane assessed
- 458.2 ha
- Not judged, on purpose
- 86.9 ha
-
04
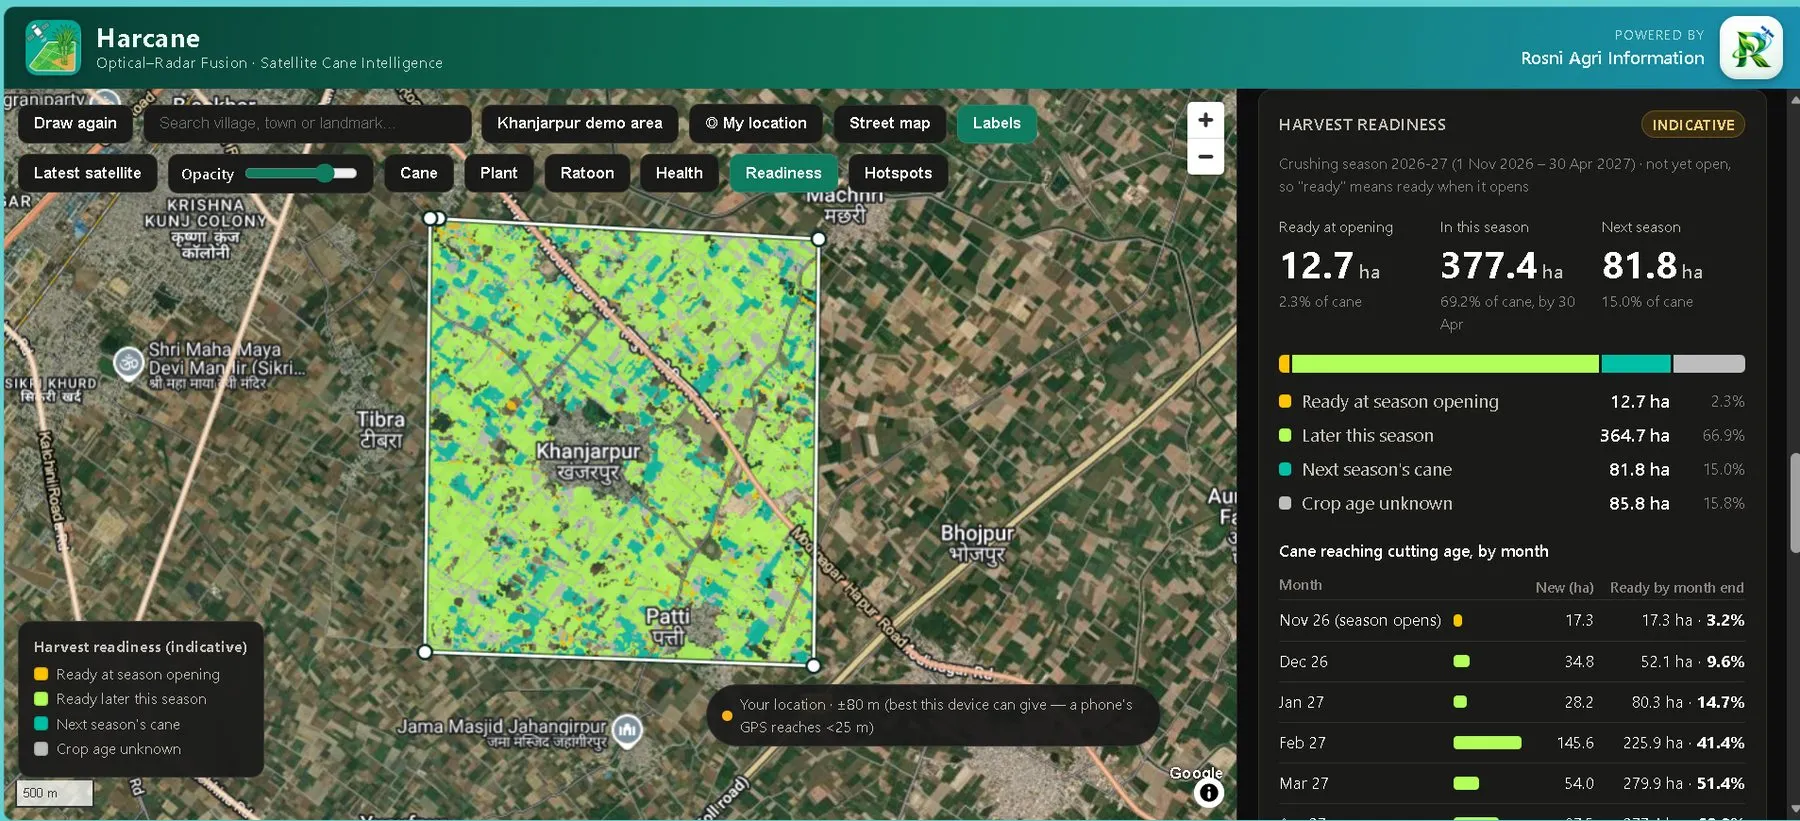
When it will be ready to cut
Crop age gives each field a maturity date, which aggregates into hectares reaching cutting age month by month — the number a crushing calendar and a supply-slip indent are actually built on.
Labelled indicative by the product itself, because it is estimated from crop age rather than measured at the gate. The 2026-27 season had not opened when this was run.
- Ready this season
- 377.4 ha · 69.2%
- Ready at opening
- 12.7 ha · 2.3%
- Next season’s cane
- 81.8 ha · 15.0%
The categories add up, on purpose
Plant cane, ratoon and unclassified sum to the 545.3 hectares of cane detected. Assessed area plus the deliberately-not-judged area sums to the same figure. Nothing is quietly dropped to make a number look better — when the two satellite signals disagree the cane is left unclassified rather than guessed, and that hectarage is printed rather than absorbed.
Khanjarpur demonstration area, near Meerut — a boundary Rosni draws to show the product, not a customer's catchment. Radar and optical imagery of 25 September 2026; last cloud-free optical pass 20 September 2026. Basemap © Google.
What it does
The whole catchment, measured from orbit
- Crop survey — plant and ratoon area
- Total cane area split between plant and ratoon crop, resolved to farmer, village, centre and mill total.
- Standing crop area
- The same breakdown for standing crop, updated every fortnight through the season rather than estimated once at the start.
- Yield estimation
- Field-wise and total yield estimation across both plant and ratoon crop, so the crushing plan is built on a measured expectation.
- Sugarcane health monitoring
- Probable low-productivity fields identified by satellite — so cane development effort goes where it changes the outcome.
- Brix monitoring
- Satellite identification of fields with higher brix content, so harvesting can be sequenced by sugar content instead of by convenience.
- Brix improvement
- Protocol development for raising brix on individual farms, using a holistic approach driven by AI.
- Precision soil testing
- Nitrogen, phosphorus, potassium, pH and organic carbon across the catchment, through Dhara.
- Crop advisory with forewarning
- Customised advisory delivered to the mill's farmers, with early warning before an outbreak reaches the catchment.
How a catchment gets measured
-
The catchment is defined
Every village and every supplying field the mill draws from, as a boundary rather than a list.
-
It is imaged from orbit
Through the season, not once at the start — which is what makes the fortnightly refresh possible.
-
Cane is classified and read
Plant separated from ratoon, standing area measured, health and brix assessed field by field.
-
Yield is estimated per field
So the total the mill plans against is built up from measurements rather than projected from an area assumption.
-
The mill gets one auditable picture
Farmer, village, centre and mill total — a number the cane department can stand behind.
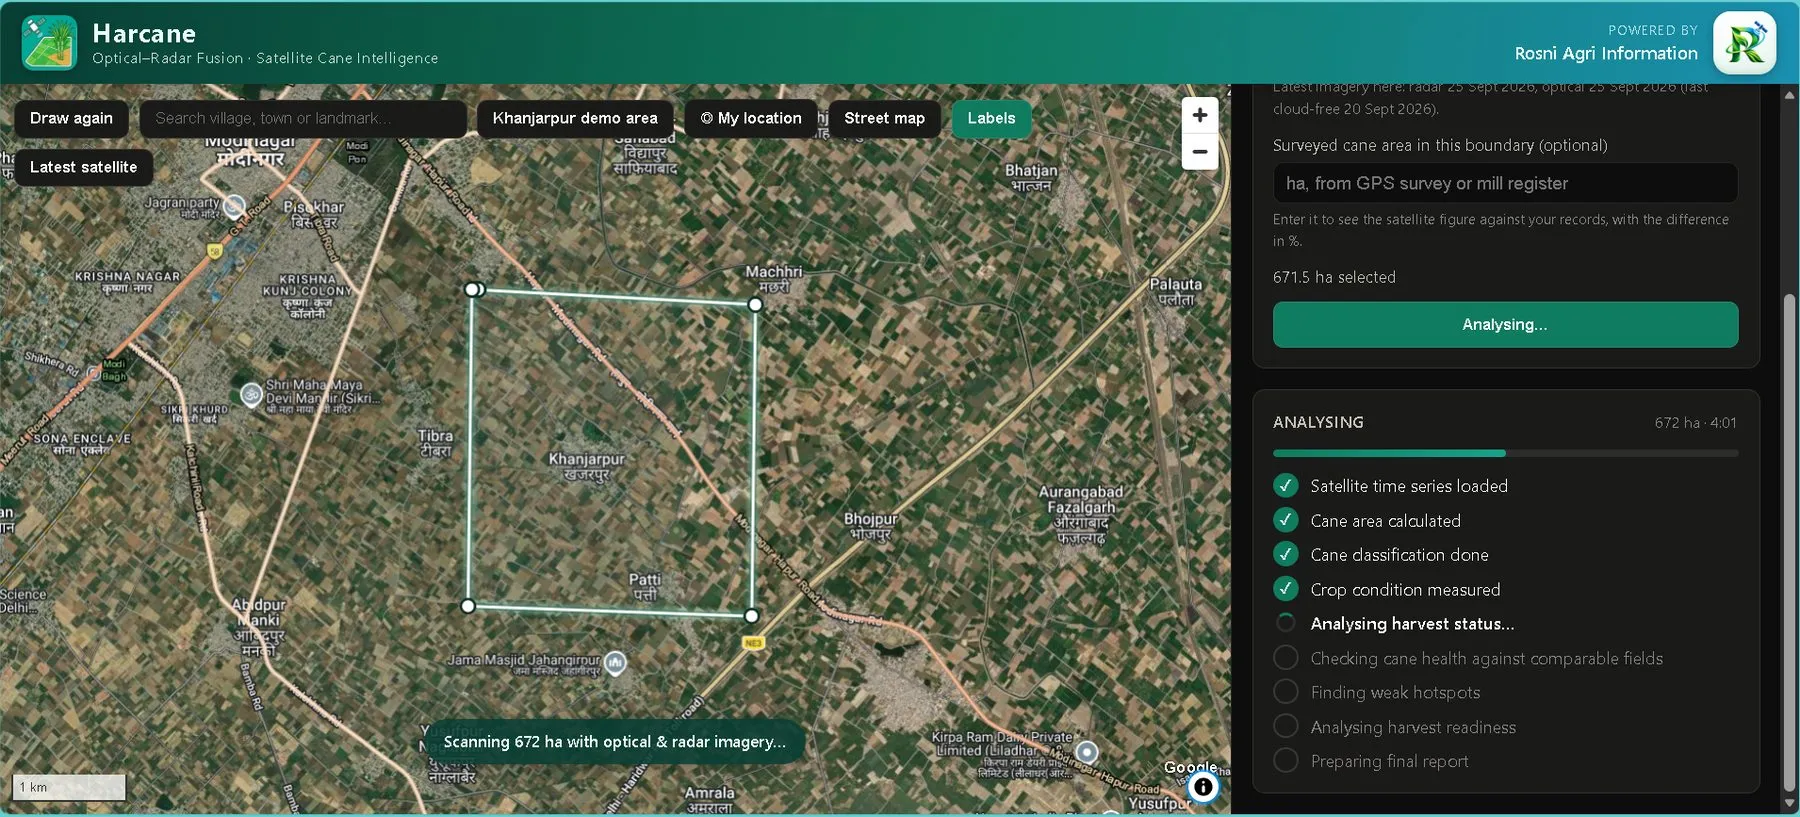
Seven measurements, not one score
A run works through the boundary step by step — time series, area, classification, condition, harvest status, comparable-field health, hotspots, readiness — and says which step it is on. A 672-hectare block takes about four minutes.
The panel also prints the imagery it is using and when it was captured, including the date of the last cloud-free optical pass. Under monsoon cloud that gap is the single most useful caveat a mill can be given, so it is shown rather than smoothed over.
Through the season
| Product | Frequency | Window |
|---|---|---|
| Plant and ratoon area survey | Annually | July – August |
| Standing crop area | Every fortnight | November – July |
| Yield estimation | Through the season | Field-wise and total |
| Soil testing | On demand | N, P, K, pH, organic carbon |
Mill and farmer
360° connectivity with your growers
Harcane is also the channel between a mill and its cane farmers.
- Inform and educate
- Reach farmers with text, images and video.
- Collect feedback
- Pest, disease and field conditions, reported from the ground.
- Book agri-inputs
- Take input requirements from farmers in advance, so procurement is planned rather than reactive.
The satellite tells the mill what is happening. This tells the mill what its farmers are seeing — and gives farmers a reason to engage with the platform measuring their fields.
What it changes
From estimate to measurement
- Area survey
- Manual, weeks, unverifiable → satellite, farmer-level, auditable
- Standing crop
- One estimate at season start → updated every fortnight
- Yield
- Projected from area assumptions → estimated field by field
- Cane development
- Spread evenly → directed at identified low-productivity fields
- Harvest sequence
- By convenience and logistics → informed by field-level brix
- Recovery
- Largely inherited → actively managed through brix protocols
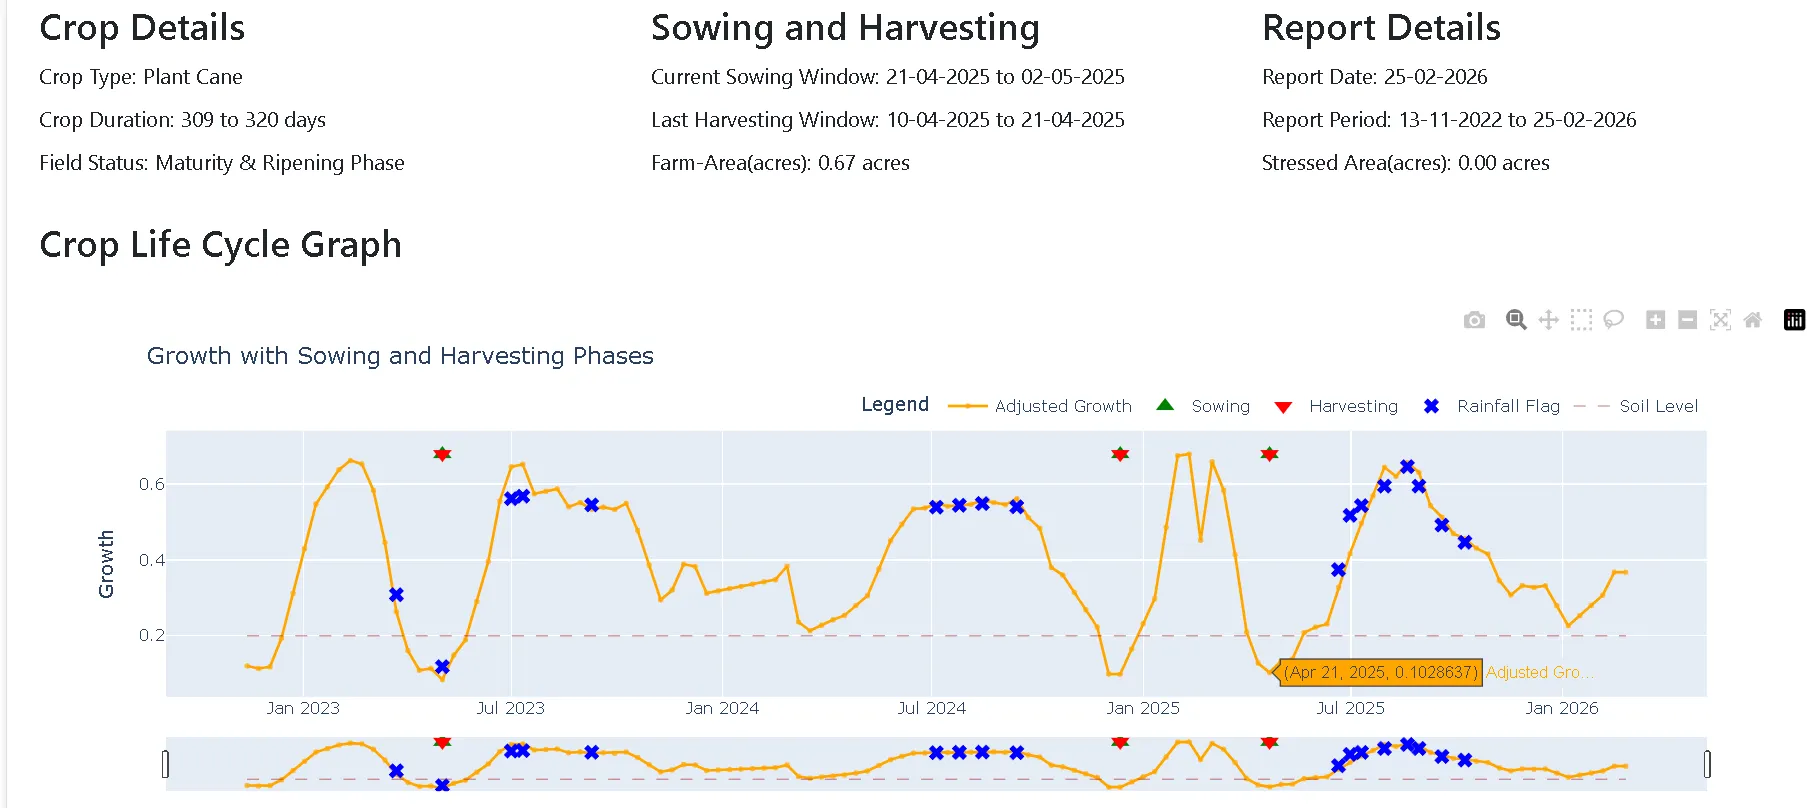
And what one plot looks like
Validation
Tested against a mill's own cane register
Before Harcane is offered to a mill, it is measured against records that mill already holds — not against a benchmark of Rosni's own choosing.
98.7%
of the mill's registered cane plots were detected as cane by satellite
- Plots tested
- 453
- Date of run
- 30 Sep 2024
- Location
- Khanjarpur, Meerut
- Season
- 2024–25
The test was simple and unflattering by design: take the plots a sugar mill already has on its register, run Harcane over the same ground on a single date, and count how many the satellite independently finds as cane. Nearly all of them, and the ones it misses are visible rather than hidden in an average.
Every figure is re-measured and recorded with each release, so a change in accuracy is something Rosni can show rather than assert. Further measures — plot-by-plot area agreement, plant-versus-ratoon classification on held-back plots, and run-to-run stability — are shared with mills and departments during evaluation.
Validated against the register of a sugar mill in the Khanjarpur area of Meerut district. The mill is not named here.
Then, your own catchment
Deployment begins with the mill's own farmer records — centre, farm identifier, coordinates, farmer name, village, contact, last crop status and variety — used to train models against the specific conditions of your catchment. Survey products are typically ready within two to four months of that data being available.
Who it is for
Everyone who depends on knowing the catchment
- Cane departments
- Verified area and standing crop, farmer by farmer.
- Mill operations
- Crushing plans built on measured yield estimates rather than assumptions.
- Cane development
- Low-productivity fields identified, so effort is directed rather than spread.
- Quality and recovery
- Field-level brix visibility, and protocols to improve it.
- Mill leadership
- One auditable picture of the entire catchment.
Beyond sugar: the capability underneath Harcane — area mapping, standing crop, yield estimation and quality monitoring across a defined catchment — applies wherever a processor depends on a grower network it does not directly control. If you procure from farmers at scale, the problem is the same one.
Start with one season, one catchment
The starting point is your existing farmer records. From there we can show you what your catchment actually looks like from above.